-
Tinovi.io is a cloud-based service, we develop telemetry devices connected with wired sensors and telemetry relay outputs. Devices connected to the tinovi.io cloud periodically sends data to a storage server. Data are viewable in user internet browser after login to dashboard. On the dashboard, historical data represented in graphs, maps, columns. Also, messaging triggers can be defined to receive e-mail or SMS.
Start your own Internet of things hosting service out of the box
Tinovi has option to embed tinovi dashboards to your own site under your brand. Also you can create your own pricing plans in tinovi administrative dashboard console.
Tinovi cloud uses
Design
Tinovi.io is designed to understand byte message formats sent by constrained battery powered devices as well as any other application including mobile.Data
Tinovi cloud can transform your binary data to JSON format and represent as nice charts to see historical data from internet connected sensors on cloud dashboard as well as custom mobile applications connected via MQTT broker.Dashboard
Data can be visualized in various ways, every type of datasource can have multiple versions of custom build and uploaded administration and online monitoring panels which can be placed on the dashboard.WE ACCELERATE BRINGING YOUR SMART THINGS TO LIVE
Tinovi have ready infrastructure, hardware and plugable software components for fast prototyping.
Components for your product prototyping:
Hardware
WiFi, GSM and ethernet enabled boards with sensor/actuator outlets and software C++ libraries based on arduino prototyping platform.
Applications
Mobile application libraries in JAVA for android.
Dashboard engine
Custom plugin enabled dashboard engine for monitoring and control - SCADA applications.
All this components are wired via MQTT cloud broker with attached Event processor engine to send notifications from your devices to email or mobile applications..
Basic features
Hosted MQTT broker for Internet Of Things
Tinovi.io provides hosted MQTT brokers accessible via TCP/IP and WebSocket as well as plain TCP/IP protocols. Each organization registered with tinovi.io has its own virtual hosted brokerStorage service with dashboards attachable to MQTT broker
With tinovi.io you can define datasources and later data feeded to that datasources may be displayed to the dashboards or accessed via REST API. Dashboards can display your data to chart or map or other dashboard components.Home page embedded UI plugins to MQTT broker
You can deploy you own plugin UI component to tinovi.io dashboard do display and control data from broker connected device.Flexible broker access options
Tinovi.io MQTT brokers are accessible via various transport options like plain TCP/IP, WebSocket, secure SSL/TLS TCP/IP and web socket connections. Authentication options offer user login/password based access as well ans machine key/pin based access to brokers.REST API for administration
Design dashboard templates and using API create users with attached dashboard template to display their data.REST API for administration
Design dashboard templates and using API create users with attached dashboard template to display their data.Tinovi cloud architecture

As shown in drawing Tinovi cloud service architecture is designed to bring service closer to customer and deliver high availability if needed.
Client is directed to globally closest datacenter where at first google cloud load balancer chooses region and regional load balancer chooses locally available computing and storage resource.
In future customer will able to chose which backend datacenter he uses and make backup copies to another zone's datacenters.
Current Tinovi service deployment contains only one multi-node backend server in Europe and backups if enabled are replicated locally between nodes.
- Per company insulated MQTT broker.
- Additional access MQTT broker via Websocket and Binary interfaces.
- Fast clustered NoSQL storage database.
- Every aspect is accessible via REST API.
- Plugin enabled Dashboard engine for online and history data access.
- Embed dashboard engine in your personal website with your own branding.
- Mobile API Libraries for cloud access.

Features for end User

Contact us
Telemetry Use Cases

Agriculture
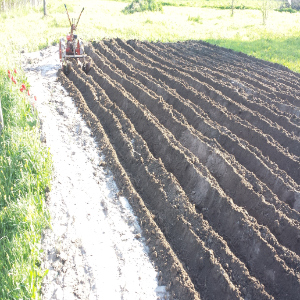
Record the temperature on the farm or in the freezer and immediately report suspected adverse deflection. To measure humidity, the temperature in the greenhouse and control ventilation actuators and water supply systems, it provides a constant climate and favorable conditions for growth. To measure the field of soil moisture and temperature, and receive notifications when taken watering or automatically start irrigation system

Home automation
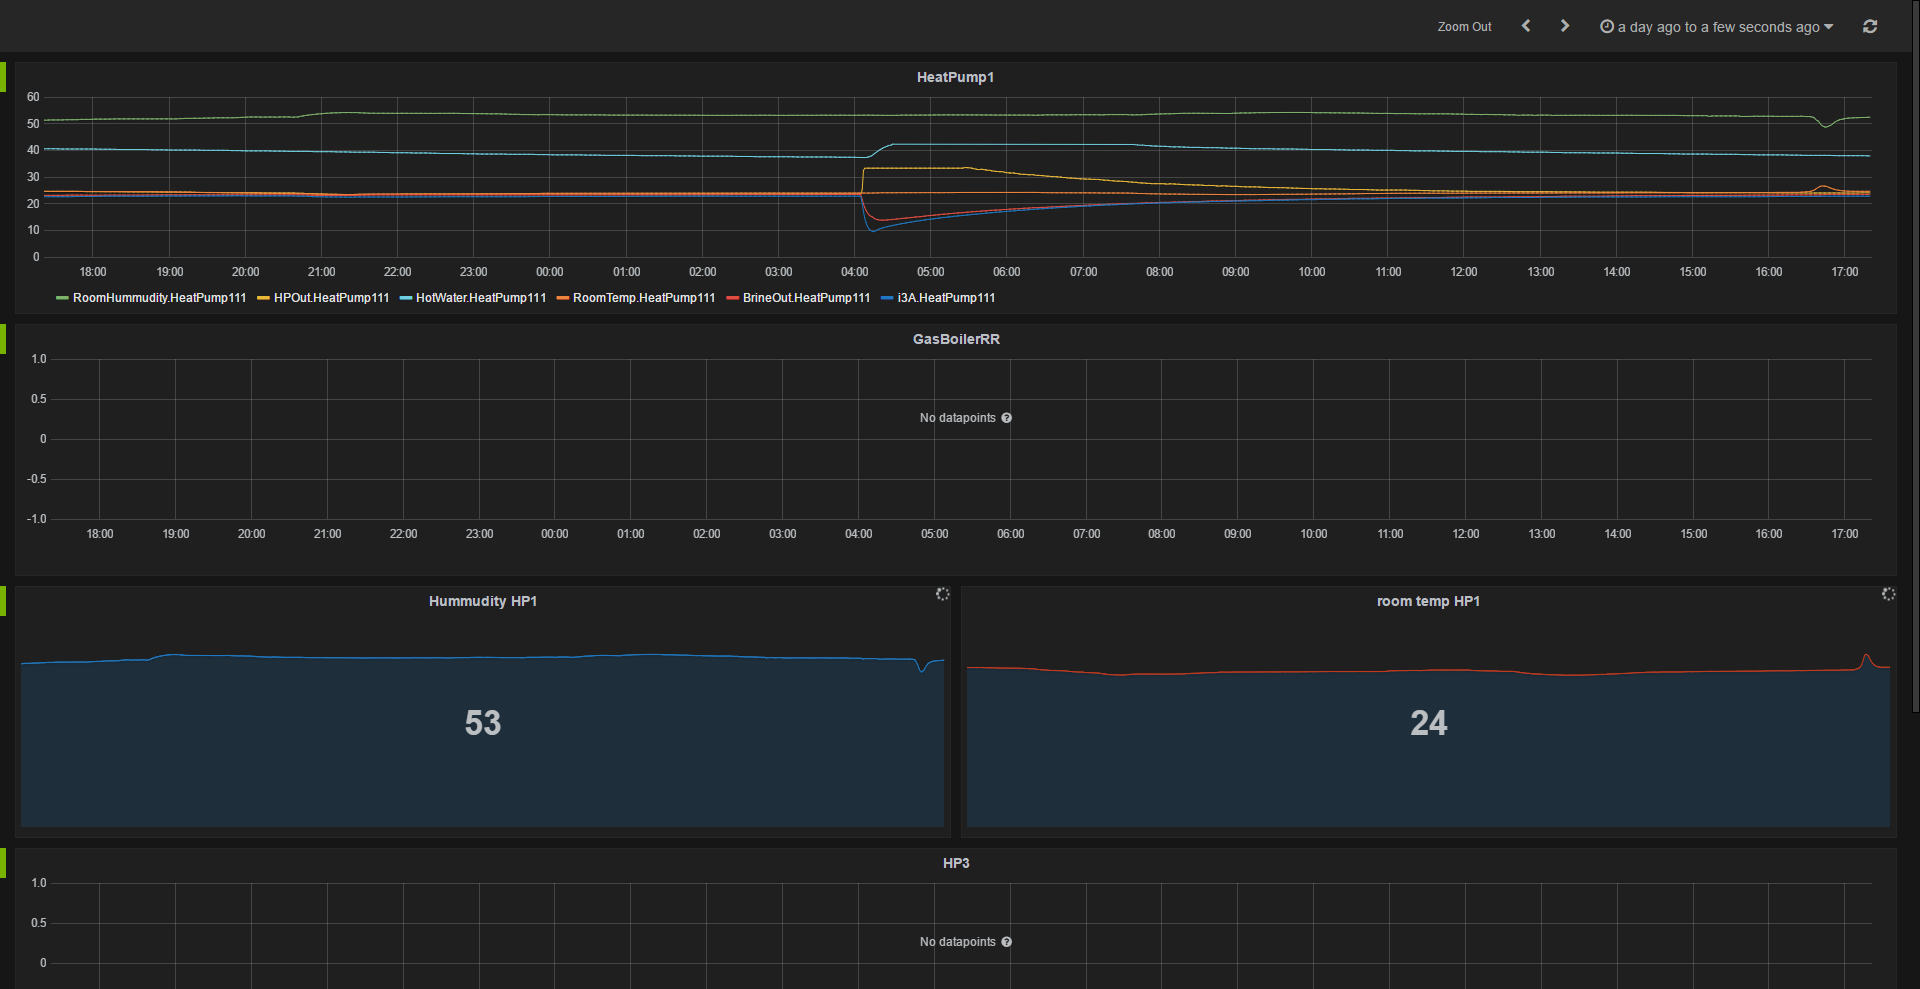
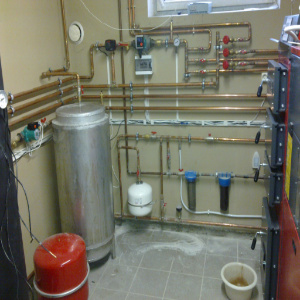
Control your home from cloud. Record the heating system supply and return temperatures, room humidity, solar collector temperature, and the heat pump brine temperature, outdoor temperature. Record the temperature of the refrigerator, to be notified if there is a water leak, turn on the electric heating if wood-fired boiler washed out, and the house temperature approaching freezing.

To house managers
Tinovi integrates to your website visually telemetry functionality to your clients look that you do provide telemetry services. Then your customers (apartment owners) could view on your website for example. a temperature is a hot water in the basement at the moment or what it had prior to the week or month.
Pricing
Tinovi service is running in the demo mode. During demo mode balance information is shown for information purposes only, Tinovi services are provided to you without any charge, there is no any balance limits.
Tinovi.io cloud will have free plans for developers and entry level usage with some traffic and storage limitation, but currently there is no any limitations.
Corporate clients we offer contract prices.
Estimated pricing plans after January 2017
1 Device
1 Device Templates
1 Organization
1 User
1 API key
2 Event triggers
0 Server triggers
50Mb Stream data Month
10Mb Storage weeks Month
500Mb API transfer Month
20 Events Month
2 Devices
2 Device Templates
2 Organization
2 User
2 API key
2 Event triggers
5 Server triggers
150Mb Stream data Month
30Mb Storage weeks Month
1500Mb API transfer Month
150 Events Month
8 Devices
4 Device Templates
8 Organization
8 User
8 API key
40 Event triggers
40 Server triggers
750Mb Stream data Month
150Mb Storage weeks Month
7500Mb API transfer Month
800 Events Month
25 Devices
10 Device Templates
20 Organization
20 User
20 API key
100 Event triggers
100 Server triggers
3750Mb Stream data Month
750Mb Storage weeks Month
37500Mb API transfer Month
2000 Events Month